News
Problem / Challenge
Concrete bridges and post-tensioned retaining structures rely on grout-filled tendon ducts to keep steel tendons from corroding. When the grout is poorly injected, voids form, water gets in, and the steel degrades often without any surface indication for years. Finding those voids without cutting into the concrete has long been difficult. Electromagnetic methods will not penetrate through steel ducts, and conventional ultrasonic imaging tends to produce results that need careful, subjective interpretation by a trained operator.
Solution
To test whether full waveform inversion improve the consistency of ultrasonic data interpretation we ran a controlled study on a reinforced concrete test block built by Screening Eagle Technologies | Proceq where the duct grouting condition was precisely known.
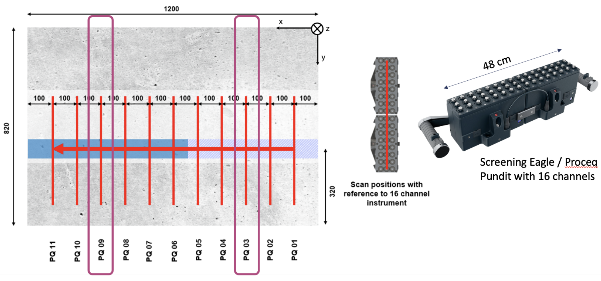
Figure 1: Data on the test block was collected at 11 scan positions using a 16-channel Proceq Pundit PD8050 ultrasonic echo device.
Before running our inversion workflow, we ran our automated calibration procedure at two of the scan positions. It recovered an average shear wave velocity of 2700 m/s and extracted the source time function of the device, with no manual input required. With those two parameters established, we built a digital twin of the test block.
The starting point in our inversion workflow is a uniform concrete block with the calibrated shear wave velocity and the external dimensions of the test piece. Measurement data was used from scan positions PQ 03 (above the ungrouted section) and PQ 09 (above the grouted section). We then ran inversions for two scenarios, a fully grouted tendon duct and a fully empty one and compared the results against measurements at scan positions PQ 03 and PQ 09.
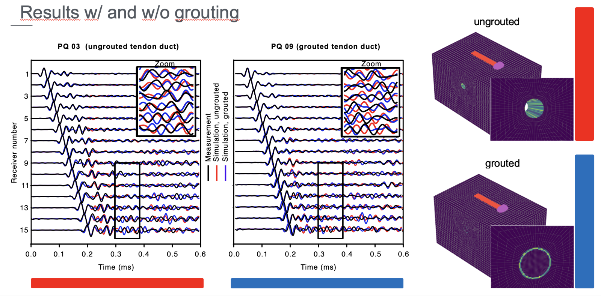
Figure 2: Measured ultrasonic data compared to digital twin simulations for two scenarios: a fully ungrouted tendon duct (red) and a fully grouted tendon duct (blue). At the scan position above the ungrouted section (PQ 03), the ungrouted simulation fits the measurements considerably better. The opposite is true at PQ 09, above the grouted section.
By quantifying the misfits between the real and synthetic datasets, Mondaic can rank the scenarios statistically. The scenario that yields the lowest misfit is identified as the most probable cause.
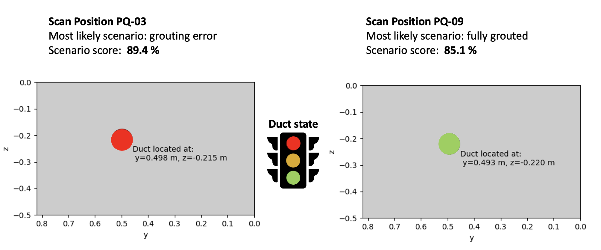
Figure 3: Quantification of PT duct grouting. Green indicates high correlation with grouted scenarios. Red denotes high correlation with ungrouted voids scenarios. This framework translates complex Salvus wavefield workflows into traceable and actionable displays for standardized asset integrity assessment.
Conclusion
In summary, we use an integrated workflow that combines Full-Waveform Inversion (FWI) and Salvus-driven scenario testing on a lab test block to check the internal condition of Post-Tensioned (PT) ducts. The first step is to use FWI to make velocity models from ultrasonic array data. This shows the real physical state of the concrete-duct interface. We then run a series of scenarios in the Salvus digital twin, from fully grouted to air-filled voids, to create a physics-based scoring. We then finally find a statistically sound "most probable cause" for the condition of the duct. This turns complicated wave physics into an objective, traceable way to measure the duct condition.
The inversion ran with no manual configuration beyond placing the device and starting the scan. Whether the approach holds up in field conditions with more complex reinforcement arrangements and less controlled concrete properties is something we are continuing to test in follow-on case studies.
References
https://www.ndt.net/search/docs.php3?id=31700