News
The emergence of fiber-optic sensing technologies such as DAS (Distributed Acoustic Sensing) is increasingly facilitating the collection of interesting seismic data in traditionally difficult to access areas, such as at the bottom of the ocean. It is especially exciting that these technologies can often be used with existing telecommunication fibers – in this example, a 45 km telecommunication link between the Greek islands of Santorini and Ios. However, this submarine DAS data can prove to be highly complex and difficult to analyze.
A useful application of DAS with such a fiber layout would be to detect and particularly locate earthquakes occurring offshore. Although seismically active regions such as Greece have many seismic stations on land, obtaining seismic measurements within the ocean is much more challenging. We can use ocean bottom seismometers; however, these are generally only deployed temporarily, and we do not have real-time access to the collected data. DAS offers the potential to obtain real-time, high-resolution measurements of earthquakes beneath our oceans.
While this experiment did successfully record earthquakes, the signals were highly incoherent and more complex than anticipated, even for the first arrivals. This incoherence also makes it difficult to pick arrival times for events, or to obtain useable waveforms. This particularly limits the potential to use this data to locate seismic events.
In order to further understand the observed data, Salvus was used to model the domain and compute synthetic strains for earthquakes.
First, Salvus was used to forward model events. Using events with known magnitudes and locations (reported in seismic network catalogues), the events were simulated in Salvus. This gave an indication of whether the complexity observed in the data was adequately reproduced in the model.
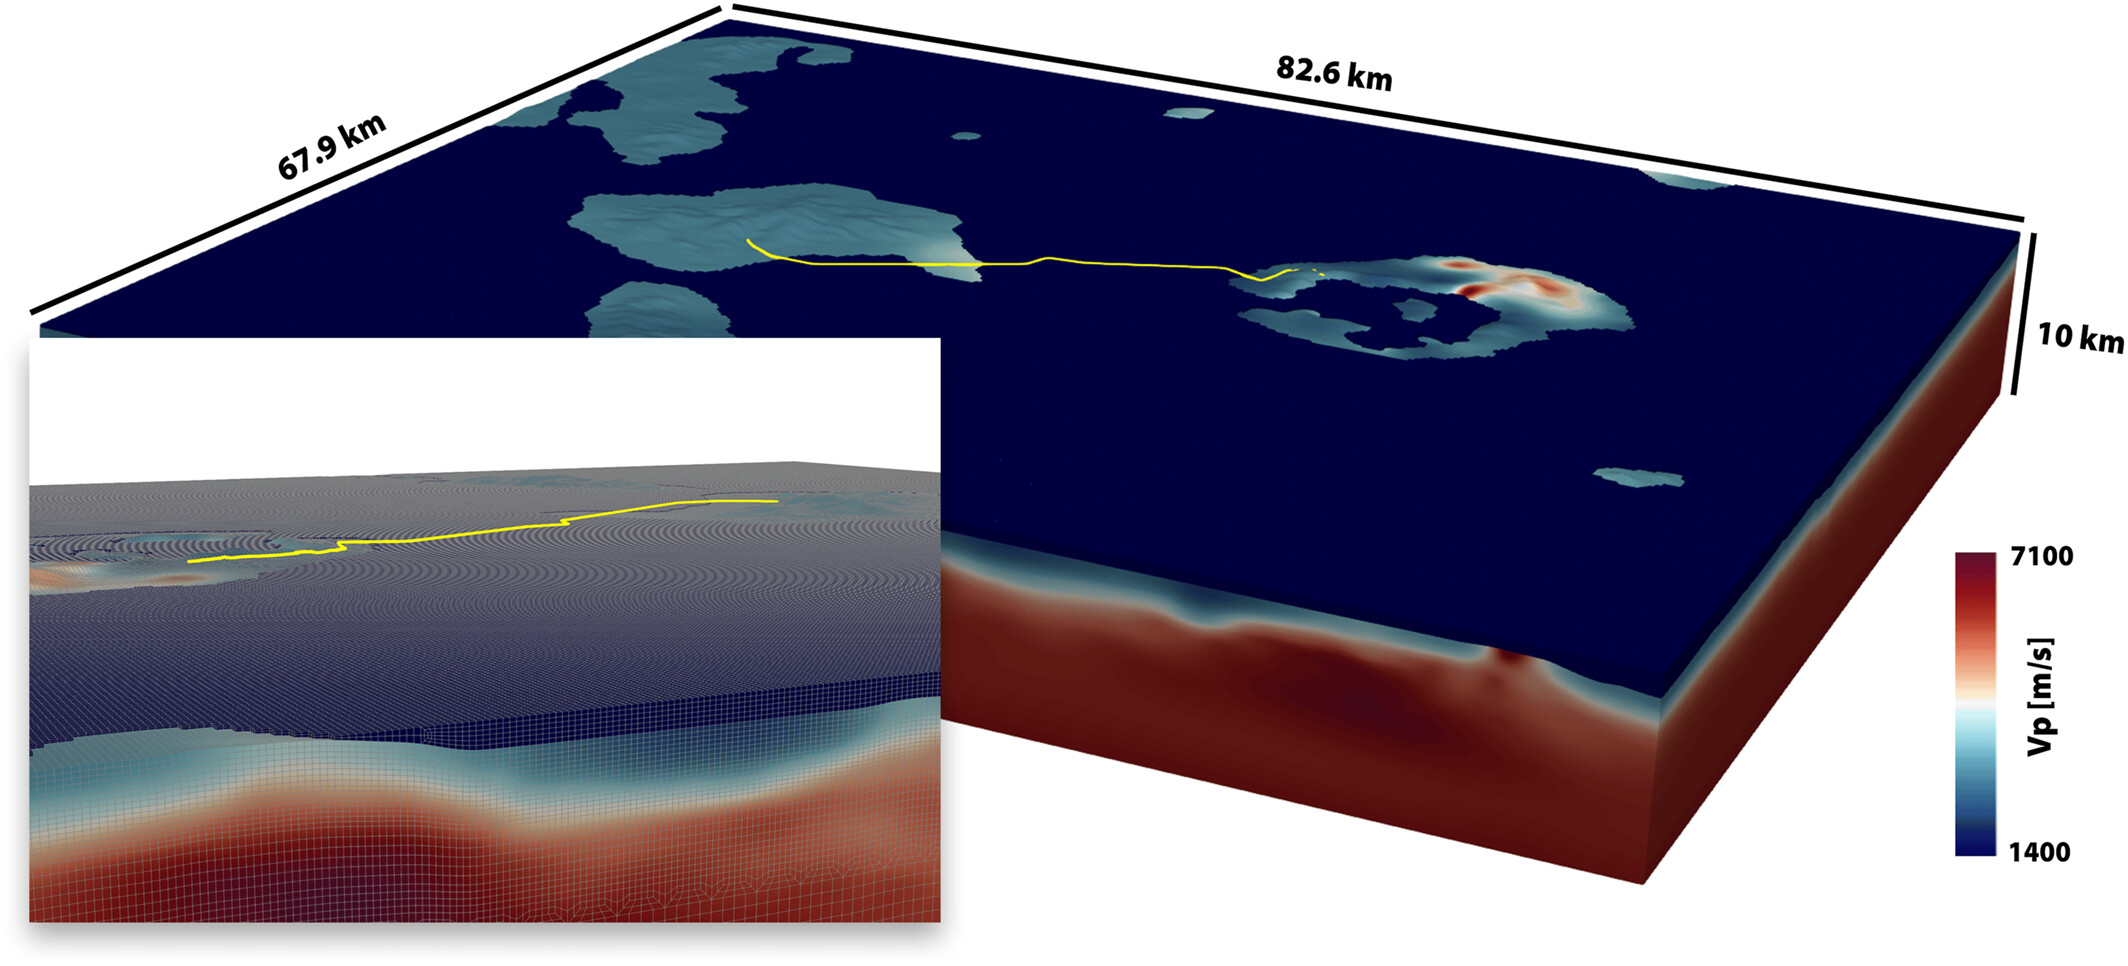
A mesh was generated, spanning 83 x 68 x 10 km, with simulations up to frequencies of 3Hz. The most complex mesh (including topography, a heterogeneous velocity model, and a water layer) consisted of 1.3 million elements.
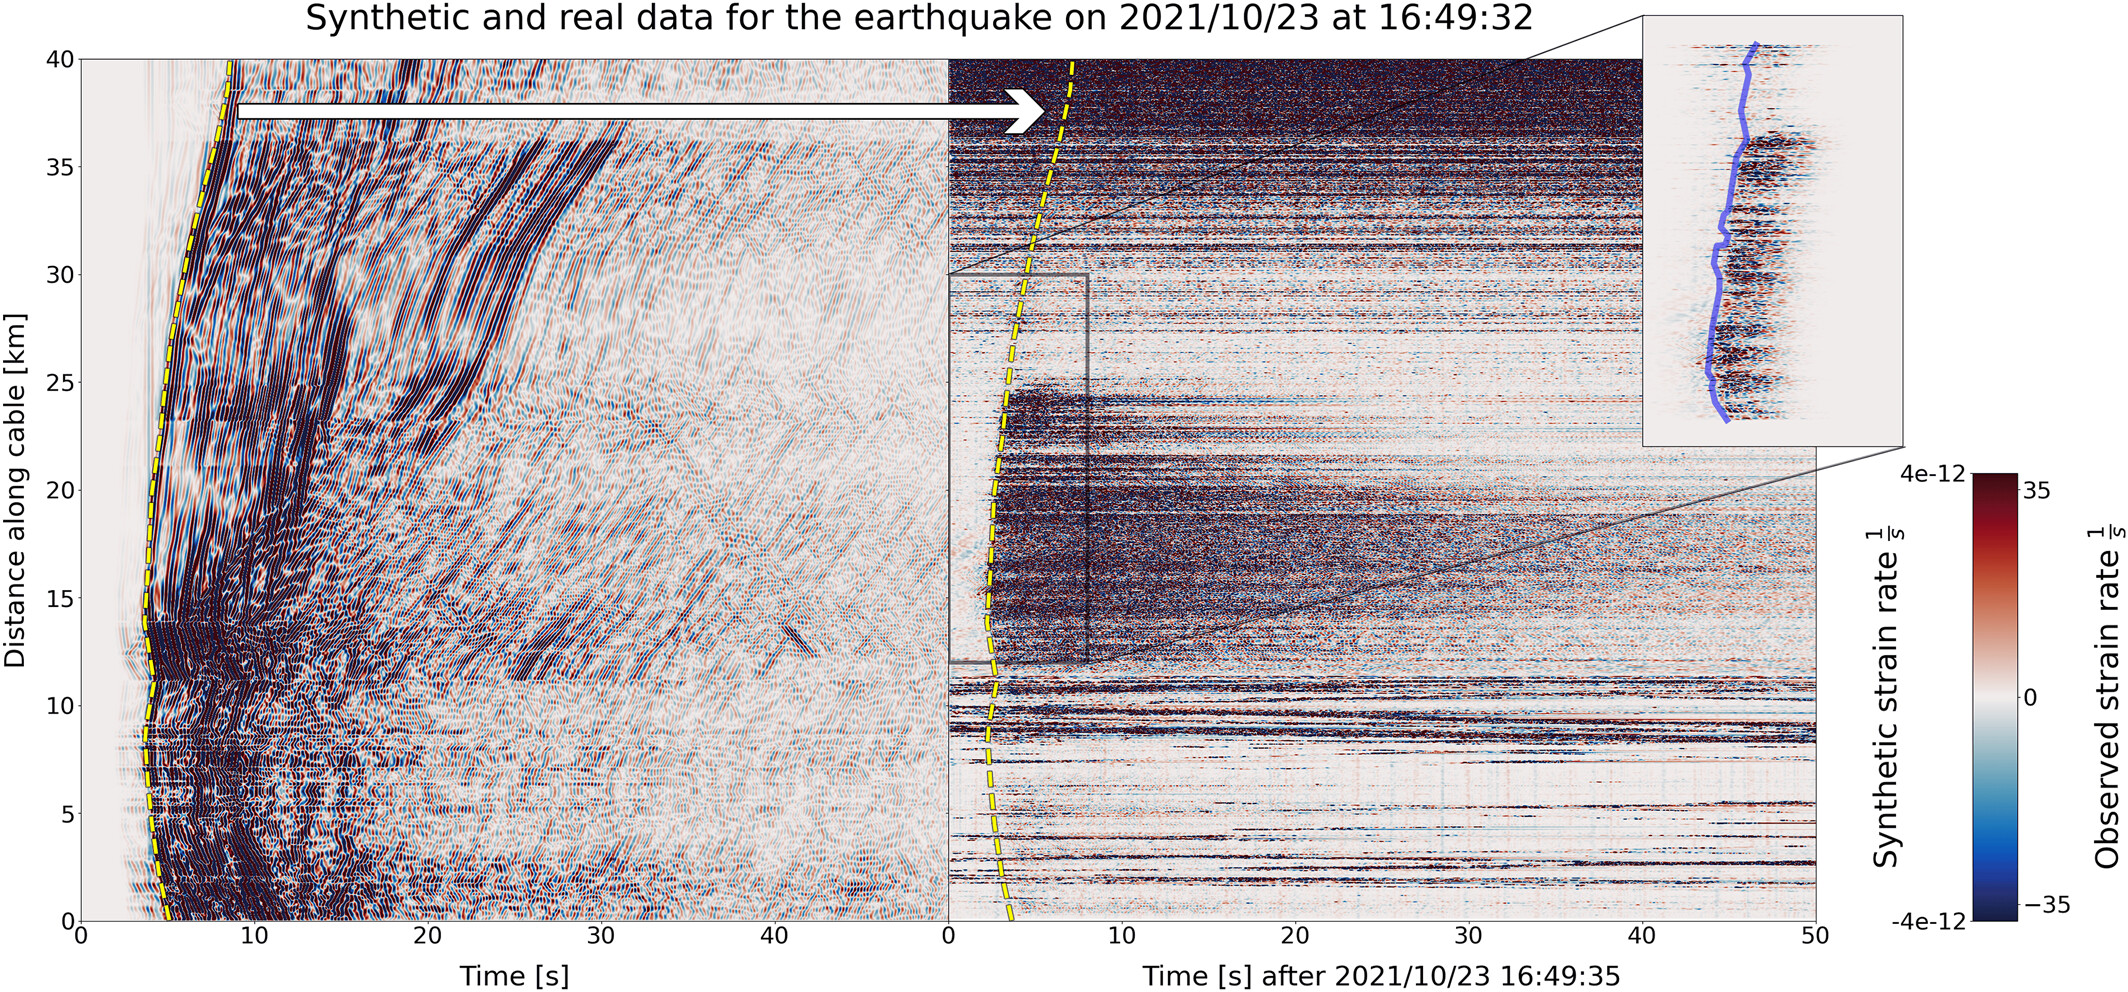
The S-wave arrivals show strong agreement between the simulated and observed data. However, it is clear that the observed data is far noisier and less coherent than the simulated data.
Backpropagation is then used to assess the potential for locating seismic events with this data.
Backpropagation involves reinjecting the observed wavefield at all receiver locations. This means that each receiver functions like a source. If the backpropagation is successful, the reinjected wavefield should converge, resulting in a maximum at the true event location.
Given the complexity of the observed data, and the approximately linear layout of the fiber, it was unclear whether backpropagation in this experimental setup would successfully locate seismic events. In order the understand the limiting factors, backpropagation was performed using Salvus-simulated data, with varying degrees of model complexity. The model complexity was incrementally increased in Salvus, as detailed in the figure caption below:
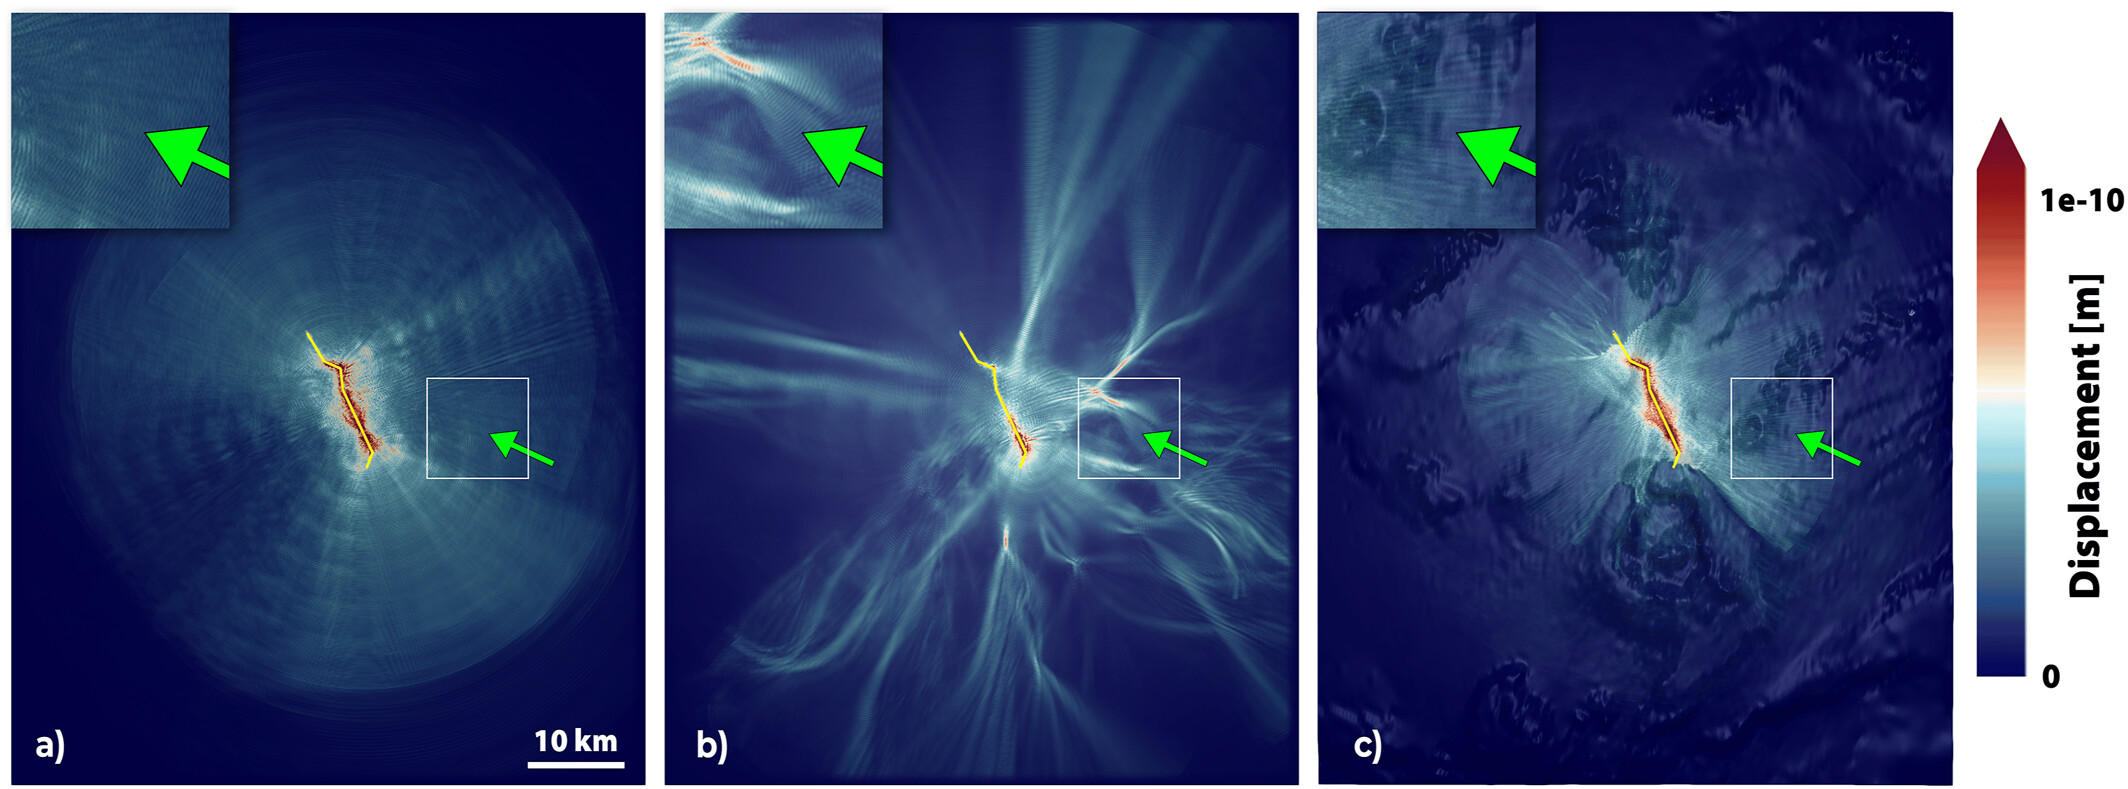
Figures a and c, with layered velocity models, show no convergence. Figure b, with flat topography but a heterogeneous velocity model, does show some convergence, which is also close to the true location of the event.
The same simulations are shown in video form below:
Real DAS data can be incredibly complex. Although DAS offers exciting seismic potential, particularly for capturing signals underwater, the observed wavefields can be noisy, incoherent, and difficult to interpret. Using Salvus with our DAS-specific package Pyber, it is possible to simulate high-resolution DAS data in seismically complex environments, accounting for features such as topography, bathymetry, heterogeneous velocity models and water layers. This can aid in understanding the complexity of DAS data and improving experimental design for future projects.
Igel, Jonas KH, et al. Challenges in submarine fiber‐optic earthquake monitoring. Journal of Geophysical Research: Solid Earth 129.12 (2024): e2024JB029556. doi: 10.1029/2024JB029556
Figures have been reproduced following CC BY 4.0 guidance.
A subset of the data is available from Igel et al. 2024: Igel, J., Klaasen, S., Sebastian,N., Nomikou, P., Karantzalos, K., & Fichtner, A.(2024). Challenges in submarine fiber‐optic earthquake monitoring [Dataset]. Zenodo. https://doi.org/10.5281/zenodo.11241132