
Ultrasonic NDT · PT Ducts
Post-Tensioned Duct Inspection
Quantify grouting quality with ultrasound.
W-Scan compares ultrasonic measurements with physically realistic 3D digital twin simulations to assess post-tensioning ducts, segment by segment, with a confidence level for each verdict.
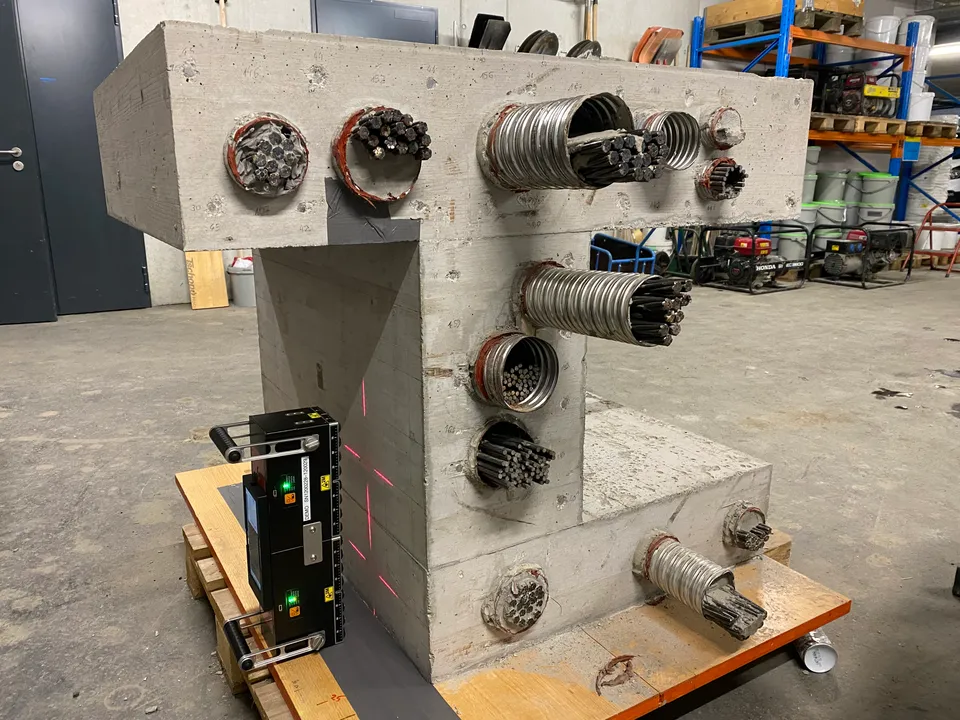
The Inspection Challenge
See Inside Steel Ducts
Grout protects the steel tendons inside post-tensioned concrete. Voids can leave those tendons vulnerable to corrosion, with little indication at the surface.
Ultrasound can reveal grouting defects behind steel ducts, where ground penetrating radar cannot. The challenge is interpreting complex pulse-echo signals consistently.
W-Scan models show how waves travel through the structure for plausible grouting conditions, then compares those predictions with the measurement. Both the amplitude and phase of the signals contribute to the assessment.
Explore the inspection workflowHow It Works
From Measurement to Grouting Assessment
Acquire on-site data, simulate the possible grouting states, and classify each duct segment. Explore the same inspection workflow used in W-Scan.
Inside the Method
A Digital Twin Calibrated to Your Inspection
CALIBRATION
Represent the Measurement
Automatically estimate the concrete shear-wave velocity and the effective source pulse for each measurement. No backwall calibration is required.
DUCT LOCALIZATION
Map the Internal Geometry
Reverse-time migration (RTM) imaging locates the ducts. Automated hexahedral meshing builds a digital twin with the duct geometry and sensor positions.
SCENARIO SCORING
Evaluate Amplitude and Phase
Simulate grouted and voided reference scenarios in 3D. Compare the predicted and measured A-scans in amplitude and phase simultaneously to select the most likely grouting state.
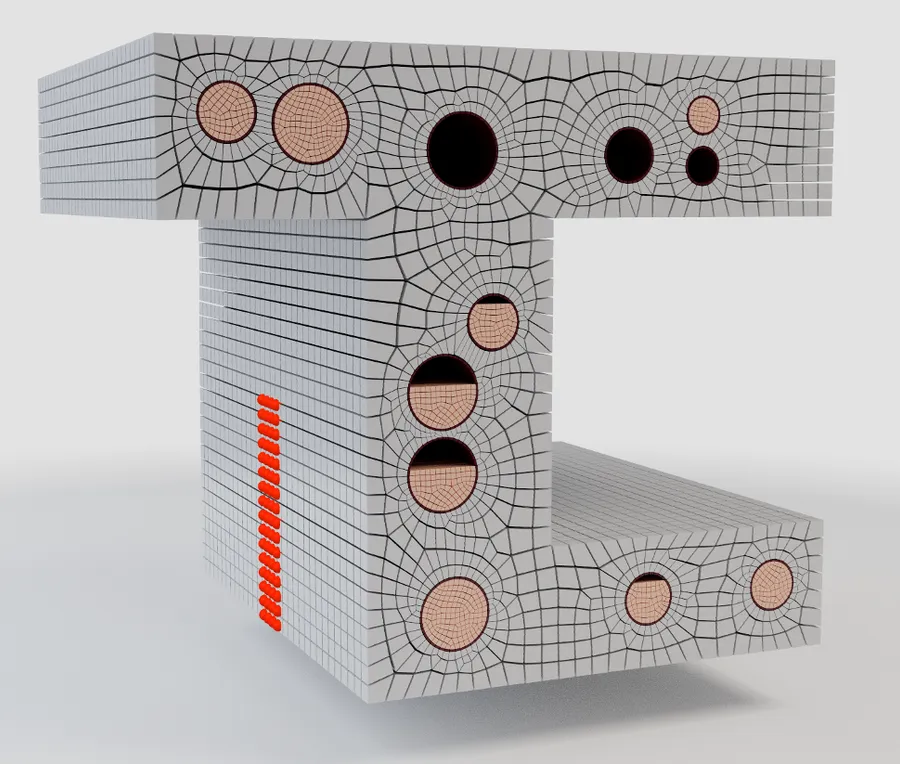
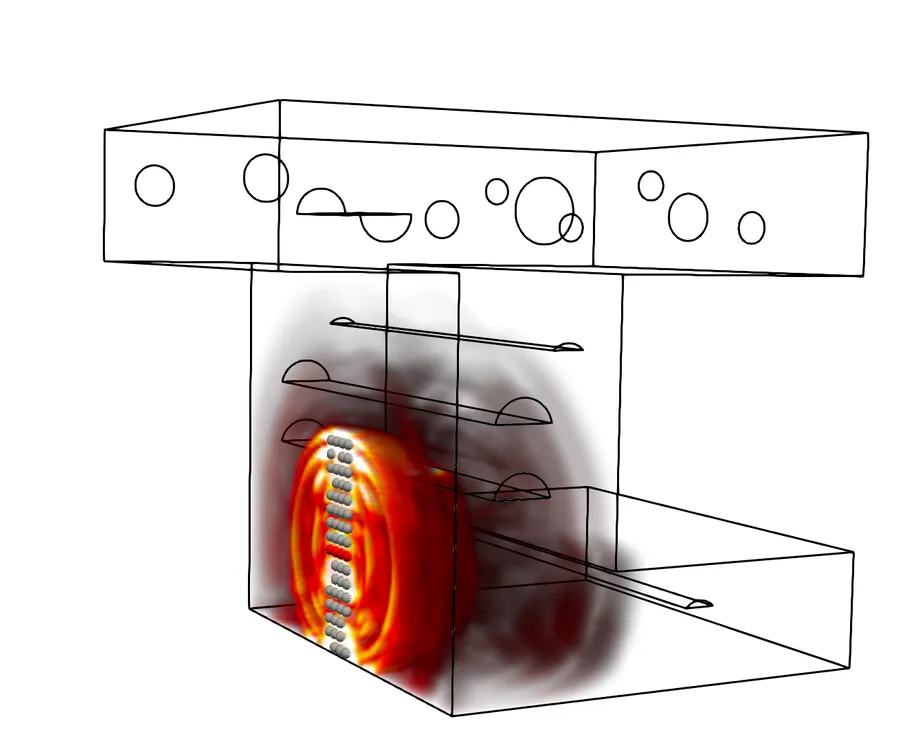
Results & Confidence
Review Every Duct Segment
Move from an overview of the duct to the measurements behind an individual verdict. Keep the grouting state, its confidence, and the supporting signals together.
- 3D duct state view
- Scan selection
- RTM image view
- A-scan comparison
A Verdict With Its Confidence Level
High and moderate confidence indicate the strength of the scenario preference. Inconclusive results and insufficient data quality remain visible for follow-up.
- Grouted High confidence
- Grouted Moderate confidence
- Ungrouted High confidence
- Ungrouted Moderate confidence
- Inconclusive No clear scenario preference
- Insufficient data quality Further measurement needed
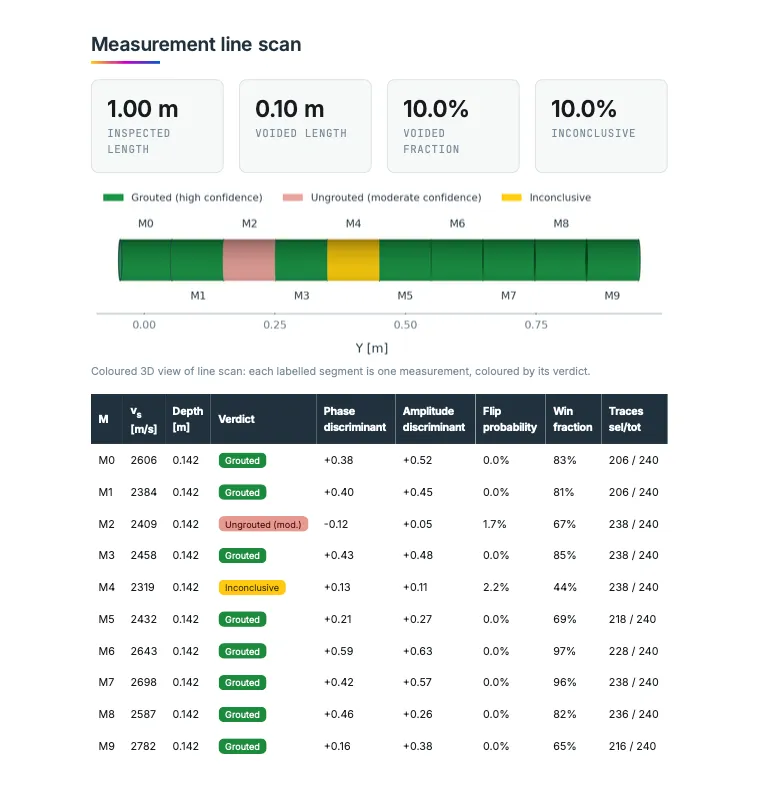
Reporting
From Assessment to Inspection Report
Automatically generate reporting material from the analysis. Export editable Word or Markdown files, or a PDF for sharing and review.
- Duct state assessment along the measurement line
- Amplitude and phase significance of each verdict
- Duct depth
- Concrete shear-wave velocity
See the Method in Practice
Controlled PT-Duct Test-Block Study
Review the measured and simulated signals at two positions on a concrete block with known grouted and ungrouted duct conditions.
Read the PT-duct case studyLet's Work Together
Plan Your PT-Duct Inspection
Tell us about the structure, instrument, and measurement data. We can discuss a W-Scan demonstration and the inspection workflow for your project.