Case Study
Accurate fault planes in earthquake ground motion modeling
Salvus integrates Standard Rupture Format (SRF) sources for accurate seismic hazard modeling, enabling detailed fault rupture simulations like the 2017 Mexico Puebla earthquake study.
At a Glance
- challenge
- A point source cannot capture the rupture of a large nearby fault or its effect on ground motion.
- approach
- Represent a finite fault using Standard Rupture Format data and simulate its wavefield with regional structure and topography.
- result
- A spatially and temporally varying rupture can be included in a complete ground-motion simulation.
Study Context: Numerical modeling example; the animation demonstrates the modeled source and wavefield.


When modeling teleseismic events, they are often treated as point sources – a reasonable simplification at large distances from the event. However, these point source approximations are generally insufficient to accurately model the resulting ground motion produced by ruptures on large, nearby fault planes. The modeling of these ruptures is of particular importance in the context of seismic hazard and assessing expected ground motion produced by such events.
Standard Rupture Format (SRF) (Graves, 2014) files are often used to define complex seismic sources on fault planes. This format allows the user to save a complete kinematic description of the fault rupture. The fault surface is sub-divided into subfaults, which are each represented by a point source – each of which has its own kinematic description of its contribution to the overall fault rupture. SRF also allows for the description of complex fault geometries.
Working together with researchers from ETH Zurich and the Barcelona Supercomputing Center (BSC), SRF sources have been integrated into Salvus, allowing users to directly read SRF files into Salvus and use them to simulate local fault ruptures and the resulting ground motion. An example is shown here for the 2017 Mexico Puebla earthquake.
2017 Mexico Puebla Earthquake
The magnitude 7.1 Puebla earthquake occurred 120 km from Mexico City, and was particularly destructive due to high shaking intensity, resulting in 370 deaths, thousands of injuries and billions of dollars of damage to infrastructure. In this example, we read in an SRF file describing the rupture on the fault plane, simulate the wave propagation in the full volume, and record the surface motion at a receiver in Mexico City.
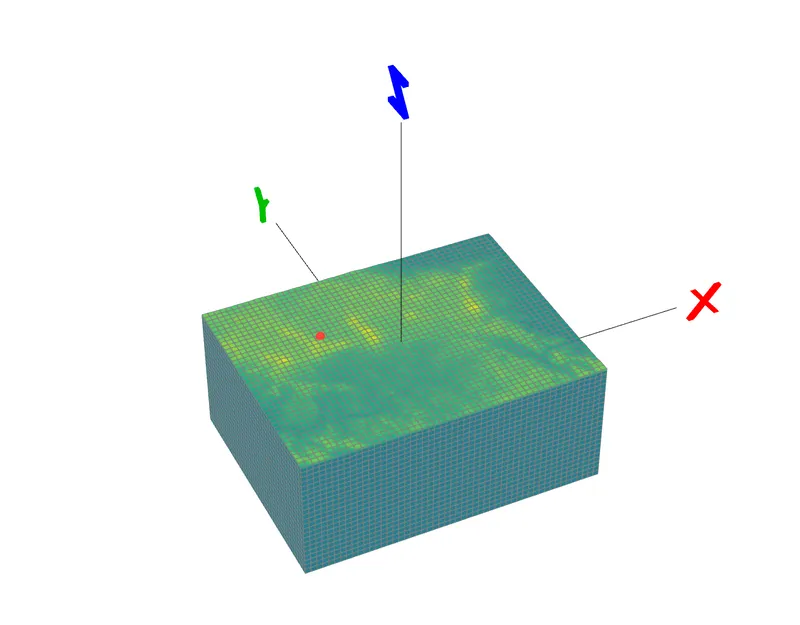
Spectral-element mesh with surface topography and a seismic station in Mexico City (shown in red).
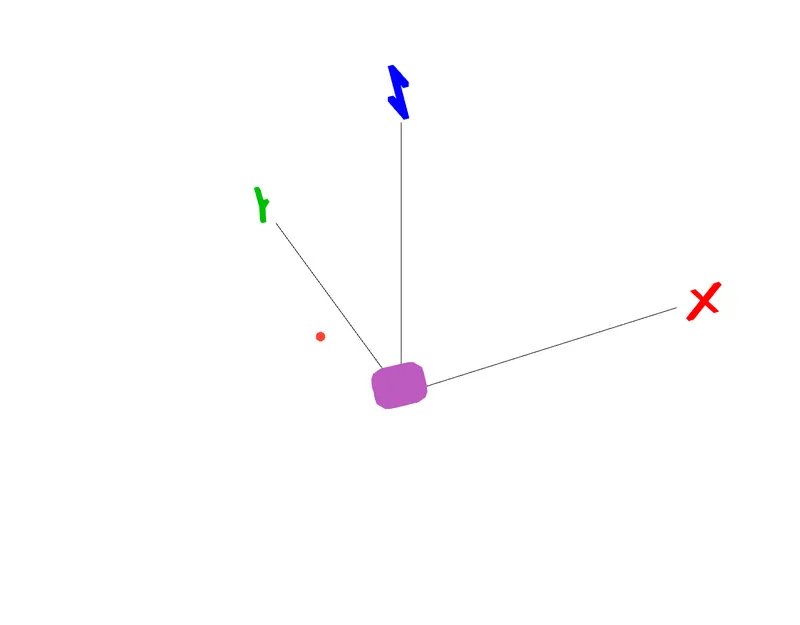
Station in Mexico City (shown in red) relative to the fault plane (shown in purple), seen from the same perspective as the previous image.
Visualizing the Fault and Earthquake Mechanism
Once the SRF file has been read into Salvus, we can clearly visualize the many point sources that approximate the motion on the fault plane. Here we can see: (a) the individual focal mechanisms for each point source, representing how that subsection of the fault moves during the fault rupture; (b) the initiation time of each subfault, showing how the rupture propagates across the larger fault surface through time; (c) the slip resulting from each of these point sources, which is notably concentrated in some areas of the fault plane. In this example, one can also see that some areas on the fault plane do not slip.
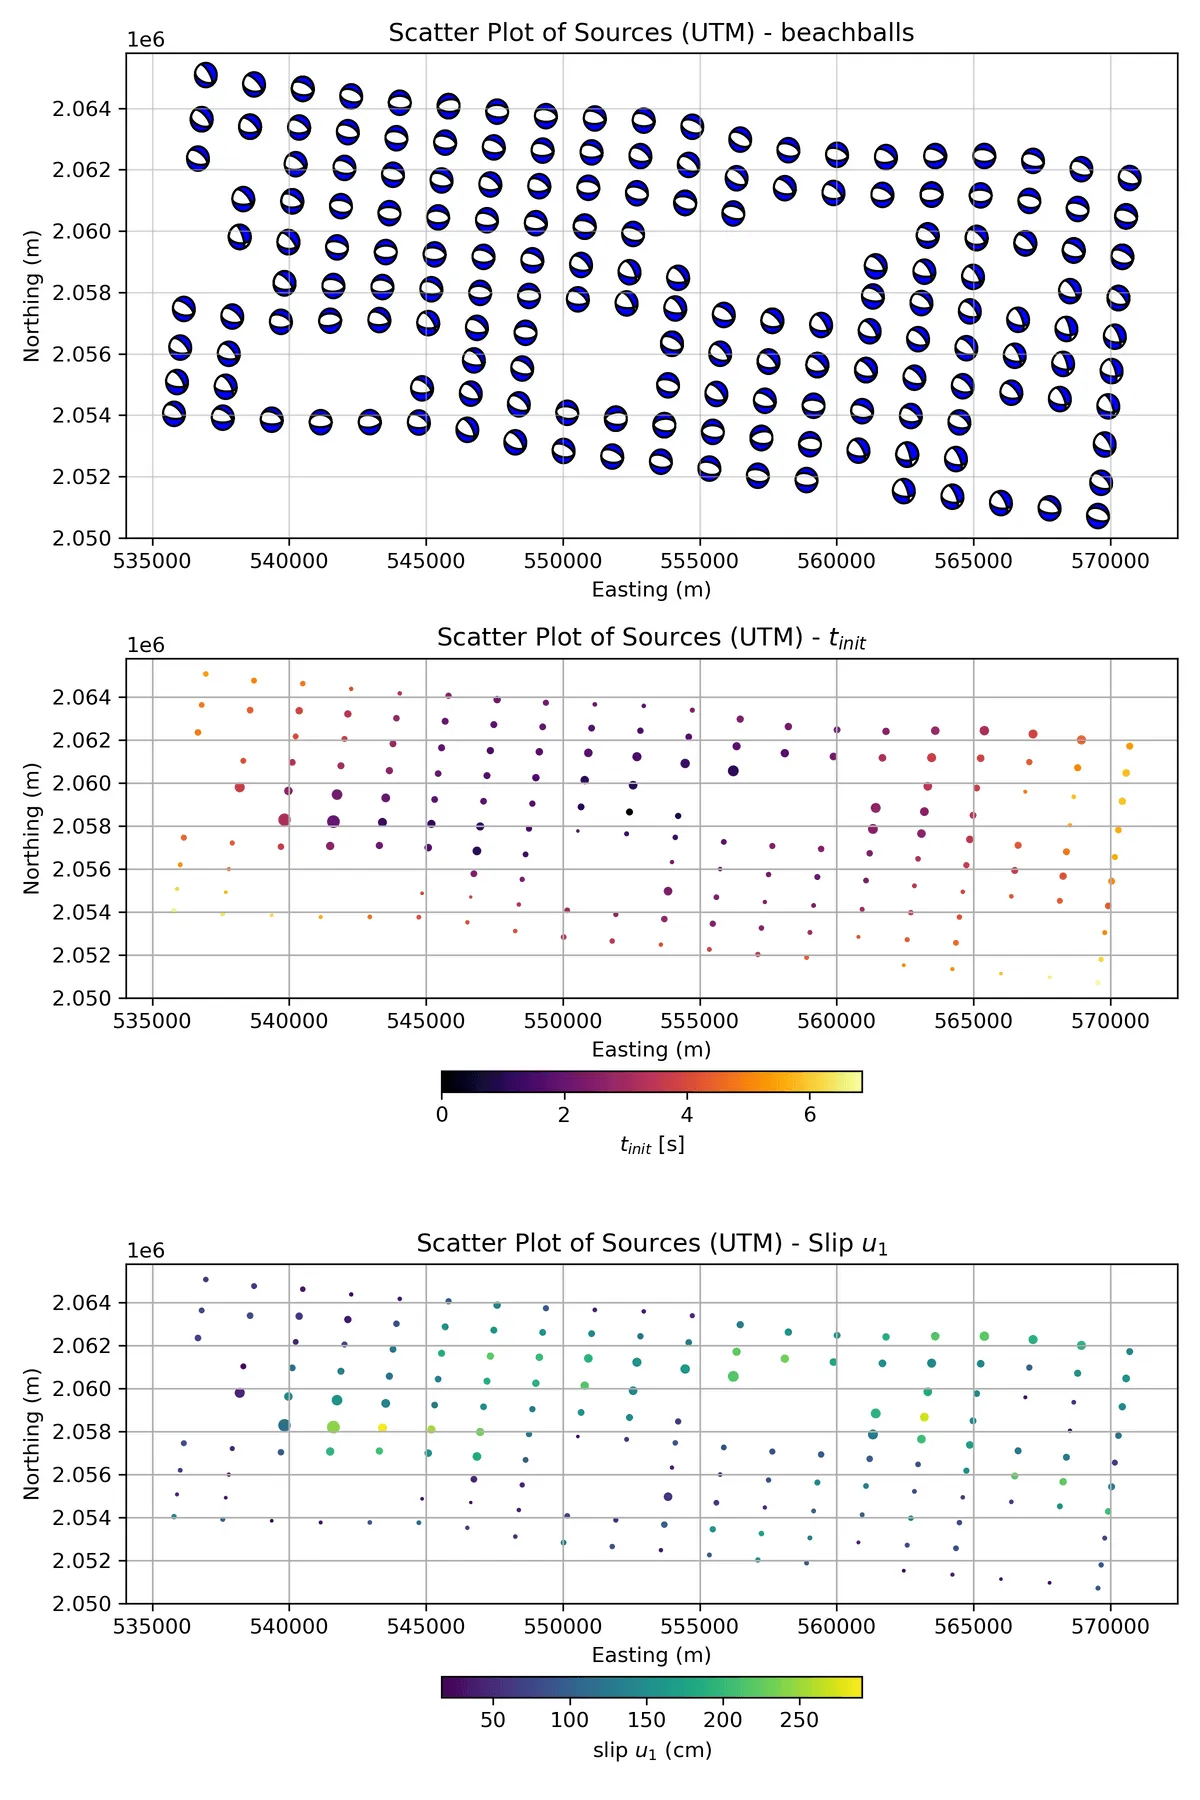
Different ways of visualizing the earthquake sources distributed along the fault plane. (top): moment tensor source mechanisms, (middle): onset times, (bottom): slip.
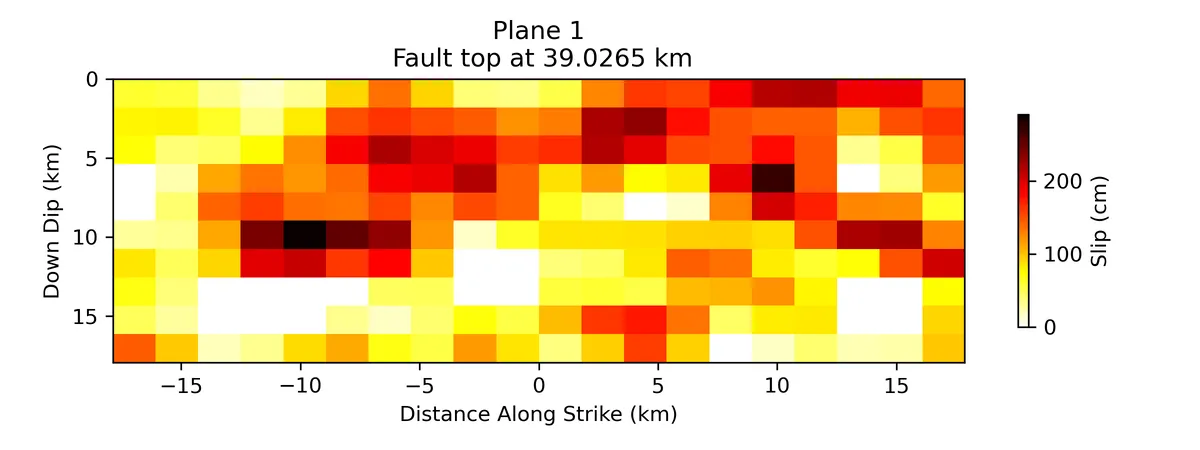
Slip distribution along the fault plane.
Animation
We are now able to simulate the forward wavefield resulting from this complex fault rupture, including the influence of topography, which can have a significant impact on ground shaking. The video below shows how the fault plane ruptures, as well as the propagation of the wavefield, with the color representing velocity.

Mexico City Standard Rupture Format animation
Loading this video connects to YouTube, sharing your IP address and browser information. The provider may use cookies or similar storage.
Open on YouTube Privacy detailsAcknowledgements
This work has received funding from the European Union’s Horizon Europe research and innovation programme under grant agreement no. 101058129 (DT-Geo), working towards constructing digital twins to estimate and analyze the impacts of seismic events. Visit the DT Geo website for more information. We also gratefully acknowledge the Swiss State Secretariat for Education, Research and Innovation for their support.

Let's Work Together
Have a Similar Question?
Tell us what you need to model or understand. We can help you choose software, plan a study, or work with your measurements.